Journal of Korean Society of Dental Hygiene![]() Open access, Peer Reviewed
Open access, Peer Reviewed
pISSN 2287-1705, eISSN 2288-2294
Weeks in Review
Weeks to Publication
Journal of Korean Society of Dental Hygiene![]() Open access, Peer Reviewed
Open access, Peer Reviewed
pISSN 2287-1705, eISSN 2288-2294
1Department of Public Health, Graduate School, Chungnam National University
2Health Medical Information Research Center
Correspondence to Sang-Hee Lee, Health Medical Information Research Center, 25 Mannyeon-ro, Seo-gu, Daejeon-si, 35201, Korea. Tel: +82-42-472-5222, E-mail: iris24022@gmail.com
Volume 24, Number 6, Pages 533-41, December 2024.
J Korean Soc Dent Hyg 2024;24(6):533-42. https://doi.org/10.13065/jksdh.20240602
Received on August 19, 2024 , Revised on October 10, 2024, Accepted on October 25, 2024, Published on December 30, 2024.
Copyright © 2024 Journal of Korean Society of Dental Hygiene.
This is an Open Access article distributed under the terms of the Creative Commons Attribution Non-Commercial License(http://creativecommons.org/licenses/by-nc/4.0)

Objectives: This study aims to provide essential data for developing dental health insurance policies by identifying changes in the rate of unmet dental care needs among older adults aged 65 to 70 years before and after implementing the policies. Methods: We used the Korean National Health and Nutrition Examination Survey (KNHNES) from 2007 to 2022. We performed an interrupted time series analysis, with consideration of the intervention point (set in 2016), by dividing the participants into an experimental (urban older adults) and a control group (rural older adults). Results: The unmet dental care needs rate was 31.2% for urban and 34.3% for rural older adults. After the policy implementation, the trend of unmet dental care needs among urban older adults showed a decreasing tendency (-0.3%; 95% CI: -0.73 to 0.15, p=0.186), while it showed an increasing trend in rural areas (0.3%; 95% CI: -0.73 to 1.23, p=0.603). The difference in trends between the two groups after the policy implementation was -0.5% (95% CI: -1.62 to 0.54, p=0.308). Conclusions: Due to the lack of statistical significance, it is possible that external factors other than policy implementation influenced the results. Therefore, there is a need to continuously assess the impact of dental policies on unmet dental care needs.
Dental care, Dental insurance, Health disparities, Health services accessibility, Time series analysis
Health inequality is a major societal problem, and to mitigate it, the Ministry of Health and Welfare (MOHW) has proposed prolonging healthy life and improving health equity as the overall goals of the 5th National Health Promotion Plan (HP 2030) [1]. While managing human factors, such as an individual’s oral health and socioeconomic status, is important, improving the physical and social environmental factors of the community surrounding an individual is important from an older adult health equity perspective [2,3].
The World Dental Federation (WDF) defines oral health as the ability to speak, smile, smell, taste, chew, and swallow without pain, discomfort, or craniofacial complex disorders and to convey a range of emotions through facial expressions [4]. In this regard, the World Health Organization (WHO) defines oral health inequalities as differences in oral health status that are considered avoidable, unfair, unacceptable, and unjust [5]. Poor oral health in older adults is associated with mastication and nutritional problems, which are known to have a negative impact on quality of life [6]. Among the different ways to maintain oral health, access to dental care can reduce the prevalence of oral disease, preserve dental function, and improve the quality of life [7]. A metric that can be used to assess dental access and equity is unmet dental care needs, which refers to cases where dental care services were thought to be necessary but were not utilized in the past year [8]. According to the Organization for Economic Cooperation and Development (OECD) Health at a Glance (2023) [9], the average unmet dental care experience rate among 26 OECD countries was 3.4%. According to the Korea Disease Control and Prevention Agency’s (KDCA) National Health Statistics (2022) [8], the unmet dental care experience rate in Korea was 33.1%, which is about a 10-fold difference. South Korea has a high rate of unmet dental needs even though the entire population is covered by health insurance and various policies are in place to improve dental coverage. To reinforce dental coverage, the MOHW began covering dentures in 2012, making Korea the first in the world to do so, as well as dental implants in 2014, and has since been expanding coverage in stages [10,11]. From 2014, when dental health insurance coverage began, to 2016, approximately 3.7% of the total older population utilized dental implant coverage [12], and dental expenditures for those aged 70 and older increased by more than 50% annually from 2012 to 2015 as health insurance coverage for prosthetics was phased in, including coverage for dentures and implants for older adults, expansion of eligibility age, and lowered deductibles [13]. While dental expenditures [14,15] and healthcare utilization [13,15] have increased following the implementation of dental coverage policies, research on whether the policies have resulted in oral health equity is lacking. Additionally, previous studies [14–16] have focused on older adults and those over the age of 65, even though the age of eligibility for the policy has gradually expanded to 75 years or older, 70 years or older, and 65 years or older, and they have not studied urban and rural areas.
This study seeks to determine whether dental coverage policies have had an impact on reducing unmet dental needs among older adults. We analyzed the effectiveness of the policy by grouping older adults aged 65-70 years old who were not beneficiaries before the expansion of dental coverage (2016) into urban and rural areas to compare the effects of the policy by region. We also investigated the pre- and post-policy differences using an interrupted time-series analysis.
This study utilized data from Korean National Health and Nutrition Examination Survey (KNHNES) from 2007 to 2022 to conduct a multi-group, interrupted time-series analysis. The dependent variable of this study, unmet dental care needs, was defined as responding ‘yes’ to the question “In the past year, have you ever needed dental care (examination or treatment) but did not receive it?” from the KNHNES. The stratification variables were age and region of residence. The 65–70 age group was selected to assess the rate of change in unmet dental care needs; this age group was not covered prior to 2016 as the age of denture and implant dental benefit coverage expanded then. The area of residence was defined as urban if the respondent answered ‘dong’ and rural if the respondent answered ‘eup-myeon’. The participants who met all the above conditions were 6,820 <Fig. 1>.
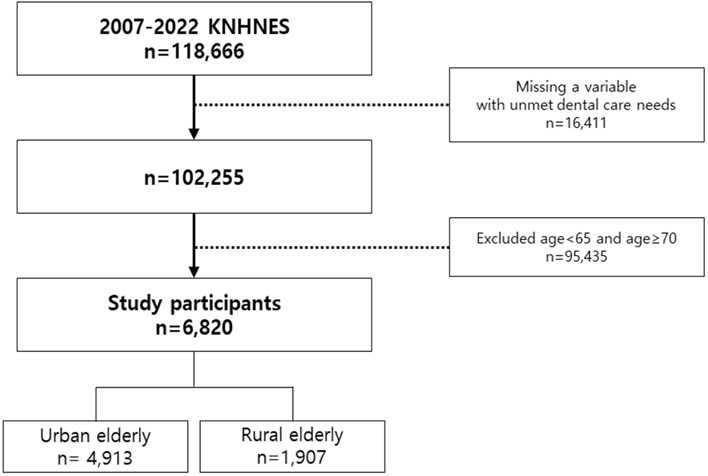
Fig. 1. Flowchart for selection of study participants
To identify pre- and post-policy changes, we utilized interrupted time-series analysis, which allowed us to evaluate policy effects by analyzing discontinuity at the time of the policy and has a low risk of internal validity without the need for a control group [17,18]. Interrupted time-series analysis allows for multiple group comparisons by establishing an experimental and control group [19]. To compare the effects of dental coverage policies on urban and rural older adults, we divided the study population into an experimental group (urban older individuals aged 65–70 years) and a control group (rural older individuals aged 65–70 years). The timing of policy implementation was 2016 (2016–2018) because the 7th period of the KNHNES was provided in three consecutive years with limited survey support from public health dentists. We set the pre-policy period to 2007–2015 and the post-policy period to 2019–2022.
The formula for the multi-group, interrupted time-series analysis utilized in this study is as follows:
Yt = β0 + β1 Tt + β2 Xt + β3 XtTt + β4 Z + β5 ZTt + β6 ZXt + β7 ZXtTt + t
Yt is the unmet dental care needs rate measured at each year (t); Tt is the number of years since the start of the study, and Xt is a dummy variable indicating the intervention, denoted by 0 for pre-intervention and 1 for post-intervention. Z is a dummy variable indicating group assignment, where 0 is the experimental group and 1 is the control group. XtTt, ZTt, ZXt, and ZXtTt are the interaction terms of the variables. To correct for possible autocorrelation in the time-series analysis and to check the model’s goodness of fit, we calculated Newey-West standard errors using the actest procedures in STATA. The cutoff was set at a p-value less than 0.05 and no longer increasing in the Cumby-Huizinga test (Ch2). We set lags 3 in the model for urban and rural older adults aged 65–70 years and lags 1 in the sensitivity analysis. A mix of three statistical programs was used depending on the methodology. We performed the composite sample design and frequency analysis with SAS 9.4 (SAS Institute., Cary, NC, USA) using the proc surveyfreq syntax. We visualized the resulting unmet dental care needs rate trends using R studio (ver. 4.3.1, R Studio Inc., Boston, MA, USA), while the interrupted time-series analysis, autocorrelation correction, and sensitivity analysis were performed through STATA (ver. 17.0; Stata Corp., College Station, TX, USA) utilizing the itsa, actest syntax. Statistical significance was based on a 0.05 level of significance.
This study utilized secondary data.
<Table 1> shows the results of the frequency analysis of the complex sample of urban and rural older adults aged 65–70 years. From 2007 to 2022, the overall unmet dental care needs rate was 31.9% with 31.2% in urban and 34.3% in rural areas. Additionally, the unmet dental care needs rate for 2016–2018, the period of dental coverage expansion, was 32.4% overall -32.3% in urban areas and 33.3% in rural areas- with rural areas having higher unmet dental care experience rates than urban areas. <Fig. 2,3> show the disparity between urban and rural seniors in terms of unmet dental care needs by year. Rural areas consistently had higher rates of unmet dental care needs than urban areas, except in 3 years (2007, 2012, and 2014).
Table 1. Frequency of study participation by region from 2007 to 2022. Units: N(weighted %)
| Year | Urban | Rural | Total | |||
|---|---|---|---|---|---|---|
| Unmet | Met | Unmet | Met | Unmet | Met | |
| 2007 | 58 (34.6) | 116 (65.4) | 33 (30.7) | 65 (69.4) | 91 (33.7) | 181 (66.3) |
| 2008 | 127 (34.8) | 192 (65.2) | 66 (35.6) | 171 (64.4) | 213 (35.0) | 343 (65.0) |
| 2009 | 141 (38.6) | 222 (61.4) | 97 (39.1) | 139 (60.9) | 238 (38.8) | 361 (61.2) |
| 2010 | 114 (32.3) | 251 (67.7) | 49 (35.8) | 90 (64.2) | 163 (33.3) | 341 (66.7) |
| 2011 | 96 (31.4) | 237 (68.6) | 52 (35.7) | 92 (64.3) | 148 (32.7) | 329 (67.3) |
| 2012 | 93 (27.6) | 258 (72.4) | 28 (25.7) | 86 (74.3) | 121 (27.2) | 344 (72.9) |
| 2013 | 90 (29.4) | 220 (70.7) | 28 (32.6) | 61 (67.4) | 118 (30.1) | 281 (69.9) |
| 2014 | 107 (31.6) | 247 (68.4) | 25 (23.9) | 81 (76.1) | 132 (30.1) | 328 (69.9) |
| 2015 | 87 (23.4) | 275 (76.6) | 45 (41.0) | 71 (59.0) | 132 (27.6) | 346 (72.5) |
| 2016-2018 | 228 (32.3) | 468 (67.7) | 63 (33.3) | 118 (66.7) | 291 (32.4) | 586 (67.6) |
| 2019 | 98 (28.6) | 230 (71.5) | 29 (30.7) | 68 (69.3) | 127 (29.0) | 298 (71.0) |
| 2020 | 97 (33.2) | 209 (66.8) | 40 (39.9) | 59 (60.1) | 137 (34.5) | 268 (65.6) |
| 2021 | 107 (32.5) | 226 (67.5) | 43 (38.4) | 73 (61.6) | 150 (33.8) | 299 (66.2) |
| 2022 | 92 (28.5) | 227 (71.5) | 44 (30.8) | 91 (69.2) | 136 (28.9) | 318 (71.1) |
| Total | 1,535 (31.2) | 3,378 (68.8) | 662 (34.3) | 1,245 (65.8) | 2,197 (31.9) | 4,623 (68.1) |
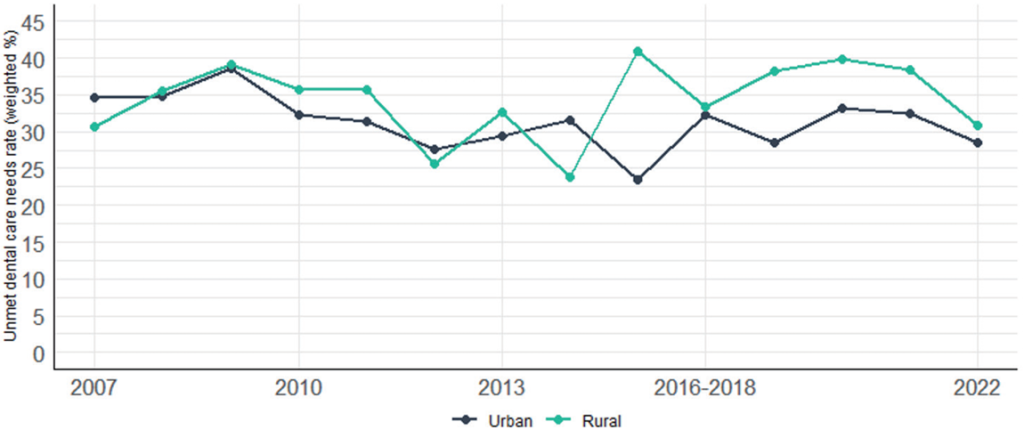
Fig. 2. Trend of rate of unmet dental care needs by region
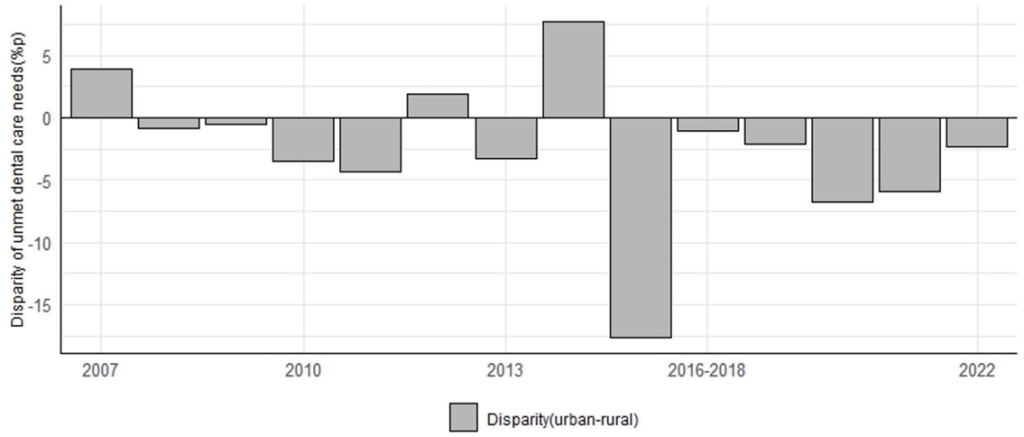
Fig. 3. Disparity of unmet dental care needs between urban and rural
<Table 2> and <Fig. 4> show the results of the interrupted time-series analysis. The slope can be used to compare the rate of change in unmet dental care needs between urban and rural areas before and after policy implementation. Moreover, the intercept (level) can be used to determine the immediate effect by indicating the average value or location of the rate of unmet dental care needs before and after policy implementation. Additionally, the trend refers to the direction of the unmet dental care needs rate over time, which allows us to identify long-term change patterns. Based on this, the slope of the unmet dental care needs rate for rural seniors before the policy was implemented decreased each year (β1 =-0.28, 95% CI: -1.53–0.96, p=0.642). The difference in the intercept between urban and rural seniors’ experience of unmet dental needs before policy implementation (β4 =2.22, 95% CI: -3.21–7.66, p=0.403) and the intercept at the time of policy implementation (β6 =5.19, 95% CI: -4.14–14.52, p=0.260) were both not statistically significant. This indicates that the two groups were similar before and at the time of policy implementation. The slope difference between the unmet needs of urban and rural seniors was -1.01% (95% CI: -2.35–0.33, p=0.132) at β5 , and the slope difference between the two groups at β7 was 0.47% (95% CI: -1.19–2.13, p=0.561); this indicates a relative decrease in the difference between the two groups after the policy was implemented compared to before the policy was implemented. However, the trend of unmet needs among the urban older adults decreased after policy implementation (β1+ β3+ β5+ β7 =-0.29, 95% CI: -0.73–0.15, p=0.186), while the rural older adults showed an increase (β1+ β3 =0.25, 95% CI: -0.73–1.23, p=0.603). The difference between the two group trends after policy implementation was -0.54% (95% CI: -1.62–0.54, p=0.308).
<Table 3> shows the results of the sensitivity analysis conducted to check the amount of change in policy implementation. The dental coverage policy was implemented in 2012 for seniors aged 75 years and above and did not include seniors aged 65–70 years at the time; thus, 2012 was selected as the intervention point for conducting sensitivity. The results show an increasing trend of 0.27% (95% CI: -0.15–0.07, p=0.199) and 0.70% (95% CI: -0.16–1.55, p=0.106) in urban and rural areas, respectively, which confirms the robustness of the interrupted time-series analysis based on 2016.
Table 2. Interrupted time-series analysis results by region
| Measure of interest | Coe | 95% CI | p | |
|---|---|---|---|---|
| Lower | Upper | |||
| (β1) Pre-intervention slope change in the rural | -0.28 | -1.53 | 0.96 | 0.642 |
| (β2) Change in the levels of the rural at the point of intervention | 1.79 | -7.00 | 10.59 | 0.675 |
| (β4) Difference in the levels of the urban and rural prior to the intervention | 2.22 | -3.21 | 7.66 | 0.403 |
| (β6) Difference in the levels of the urban and rural at the point of intervention | 5.19 | -4.14 | 14.52 | 0.260 |
| (β5) Difference in the slopes of the urban and rural before the intervention | -1.01 | -2.35 | 0.33 | 0.132 |
| (β7) Difference in the slopes of the urban and rural after the intervention compared with pre-intervention | 0.47 | -1.19 | 2.13 | 0.561 |
| (β1+β3+β5+β7) Post-intervention trend: Rural | 0.25 | -0.73 | 1.23 | 0.603 |
| (β5+β7) Post-intervention trend: Urban | -0.29 | -0.73 | 0.15 | 0.186 |
| (β5, β7) Difference post-intervention: Urban versus rural | -0.54 | -1.62 | 0.54 | 0.308 |
| (β3) Difference between pre- and post-intervention slopes | 0.53 | -1.00 | 2.06 | 0.476 |
Table 3. Sensitivity analysis results
| Measure of interest | Coe | 95% CI | p | |
|---|---|---|---|---|
| Lower | Upper | |||
| (β1+β3+β5+β7) Post-intervention trend: Urban | 0.27 | -0.15 | 0.07 | 0.199 |
| (β1+β3) Post-intervention trend: Rural | 0.70 | -0.16 | 1.55 | 0.106 |
| (β5+β7) Difference post-intervention: Urban versus rural | -0.43 | -1.38 | 0.53 | 0.362 |
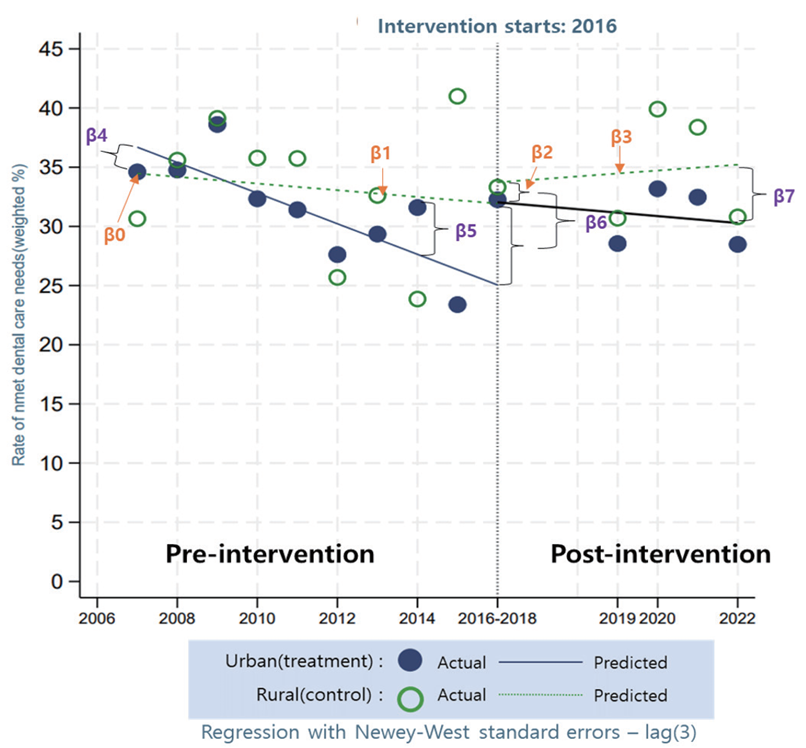
Fig. 4. Presentation of an interrupted time-series design on the rate of unmet dental care needs
This study analyzed the rate of change in the unmet dental care needs of older adults aged 65–70 years after the expansion of dental coverage policy by urban and rural residence using data from the KNHNES 2007–2022 and an interrupted time-series analysis.
We found that the gap in unmet dental care needs between urban and rural areas decreased after the policy was implemented compared to before the policy was implemented; however, the gap decreased in urban areas and increased in rural areas, widening again over time. This trend is believed to be driven by physical and social disparities in access to dental care resources between urban and rural areas. Rural and urban areas experience substantial regional health disparities, with rural areas experiencing regional inequalities in healthcare resources, access to healthcare, and quality of care compared to urban areas [20]. In rural areas in particular, exposure to health information is limited, which in turn hinders access to healthcare, especially among those with low health literacy [21]. Additionally, support and care from family members, such as an individual’s spouse, can address unmet medical needs [22]. Further, urban areas with a greater infrastructure of structural social capital, such as social engagement within the community, have better access to dental care than rural areas [23]. To improve access to dental care in rural areas, policy efforts are needed to understand the differences in access to dental care between urban and rural areas and consider geographic and sociocultural characteristics.
However, the findings were not statistically significant; thus, caution should be exercised in interpreting the results as indicating that the expansion of dental coverage had an impact on changes in the unmet dental needs of urban and rural seniors. The analysis of the parameters explaining the difference in the intercept (β4 ) and slope (β5 ) before policy implementation showed that urban and rural areas did not differ significantly in unmet dental care needs and the slope before policy implementation. This can be selected as a control for the study model if the significance level is equal to or higher than 0.05 [19]; thus, we believe that we used an appropriate model to compare the unmet dental care needs of urban and rural older adults in this study. We also conducted sensitivity analyses and corrected for possible autocorrelation in the time-series analysis to ensure the robustness and appropriateness of our model. However, the heterogeneity of the sample might have affected the statistical results as it does not reflect the differences in socio-economic background between urban and rural areas. This suggests that external factors may have played a role in the variation in the unmet dental care needs of urban and rural seniors, diluting the effect of policy implementation.
The first limitation of this study is that, while the interrupted time-series analysis used can identify the effect of the intervention by comparing periods before and after its implementation, it was challenging to isolate the policy’s impact clearly, and external factors were not sufficiently controlled. Second, this study has the disadvantage of having a relatively small number of measures for evaluation. In the interrupted time-series analysis, at least three pre- and post-intervention time points are required to measure the effects, with eight or more time points recommended for high reliability and robustness [18]. However, owing to the limitations of the research resources, this study only covers 2016–2018; thus, the number of points in time is relatively small. Third, this study fails to account for the actual utilization of dental benefits. The KNHNES, which is sampled annually, cannot identify the actual beneficiaries of dental insurance benefits, and the population is not the same every year. Therefore, future research should include follow-up studies considering the various factors that influence unmet dental care needs and an in-depth time-series analysis using longitudinal data, such as panel data. Nonetheless, this study is significant in that it groups the population into urban and rural areas, which has not been done in previous studies, and attempts to evaluate different age groups of beneficiaries to ensure the purity of the policy effect.
Based on the KNHNES 2007–2022, this study analyzed the changes in unmet dental care needs of older adults aged 65–70 years after the expansion of dental health insurance coverage in 2016 using an interrupted time-series analysis. Key findings are as follows:
1. After the policy was implemented, the trend in unmet dental care experience rates decreased in urban areas and increased in rural areas.
2. However, the above results are not statistically significant; this suggests that external factors other than policy implementation might have contributed to the change in unmet dental care needs.
Based on the above findings, it is necessary to conduct ongoing research to assess the policy effects on unmet dental care experiences in the future.
Conceptualization: JY Lim; Data collection: JY Lim; Formal analysis: JY Lim; Writing-original draft: JY Lim, SH Lee; Writingreview&editing: SH Lee
The authors declared no conflicts of interest.
None.
None.
Data can be obtained from the Korean National Health and Nutrition Examination Survey repository source.
None.
1. Ministry of Health and Welfare. Korea Health Promotion Institution. 5th Health Plan 2030, 2021-2030 revision. Seoul: Korea Health Promotion Institution; 2022: 22.
2. Lee WI, Kim SJ, Albert JM, Nelson S. Community factors predicting dental care utilization among older adults. J Am Dent Assoc 2014;145(2):150-8. https://doi.org/10.14219/jada.2013.22
[DOI][PubMed][PMC]
3. Namkung EH, Chin HY, Lee YG. Determinants of health in older adults: regional policies and social capital. Osong: Korea Institute for Health and Social Affairs; 2021: 12-3.
4. Glick M, Williams DM, Kleinman DV, Vujicic M, Watt RG, Weyant RJ. A new definition for oral health developed by the FDI World Dental Federation opens the door to a universal definition of oral health. JADA 2016;147(12):915-7. https://doi.org/10.1016/j.adaj.2016.10.001
[DOI][PubMed]
5. World Health Organization (WHO). Global oral health status report: towards universal health coverage for oral health by 2030. Geneva: World Health Organization; 2023: 1-7.
6. Gil-Montoya J, Ferreira de Mello AL, Barrios R, Gonzalez-Moles MA, Bravo M. Oral health in the elderly patient and its impact on general wellbeing: a nonsystematic review. Clin Interv Aging 2015;10:461-7. https://doi.org/10.2147/CIA.S54630
[DOI][PubMed][PMC]
7. Ahn ES, Hwang JM, Shin MS. Dental utilization associated factors among elderly. J Dent Hyg Sci 2015;15(1):60-6. https://doi.org/10.17135/jdhs.2015.15.1.60
[DOI]
8. Korea Disease Control and Prevention Agency. 2022 National Health Statistics [Internet]. Korea Disease Control and Prevention Agency; 2023[cited 2024 Jan 15]. Available from: https://knhanes.kdca.go.kr/knhanes/sub04/sub04_04_01.do.
9. Organization for Economic Cooperation and Development (OECD). Health at a Glance 2023: OECD indicators. Paris: Organization for Economic Cooperation and Development; 2023: 101-2.
10. Ministry of Health and Welfare. Full dentures for seniors aged 75 and older will be covered by insurance starting in July [Internet]. Ministry of Health and Welfare; 2012[cited 2024 Jan 15]. Available from: https://www.mohw.go.kr/board.es?mid=a10503010100&bid=0027&act=view&list_no=271421&tag=&nPage=1.
11. Ministry of Health and Welfare. Health insurance coverage for implants and other treatments for those aged 75 and older [Internet]. Ministry of Health and Welfare; 2014[cited 2024 Jan 15] Available from: https://www.mohw.go.kr/board.es?mid=a10503010100&bid=0027&act=view&list_no=300639&tag=&nPage=1.
12. Ryu JI, Jeon JE. Utilization rate of dental implant for elderly in National Health Insurance in Korea. J Korean Dent Assoc 2019;57(9):496-503. https://doi.org/10.22974/jkda.2019.57.9.001
[DOI]
13. Shin SH. The trend of National Health Insurance dental treatment in the last 10 years. HIRA Policy Trends 2020;14(6):70-84. https://repository.hira.or.kr/handle/2019.oak/2517
14. Kim NH, Jung SH, Kawachi I. Did expanded dental insurance reduce out-of-pocket expenditures on dental care among older adults in Korea? interrupted time-series analysis. Int J Environ Res Public Health 2021;18(6):3003. https://doi.org/10.3390/ijerph18063003
[DOI][PubMed][PMC]
15. Seo HW, Kim YS. Changes in dental care utilization and expenditure by the expansion policy of the health insurance coverage: Korea Health Panel Survey. J Korean Soc Dent Hyg 2012-2016. 2020;20(5):611-21. https://doi.org/10.13065/jksdh.20200056
[DOI]
16. Park HJ, Lee JH, Park SJ, Kim TI. Trends in the utilization of dental outpatient services affected by the expansion of health care benefits in South Korea to include scaling: a 6-year interrupted time-series study. J Periodontal Implant Sci 2018;48(1):3-11. https://doi.org/10.5051/jpis.2018.48.1.3
[DOI][PubMed][PMC]
17. Bernal JL, Cummins S. Gasparrini A. Interrupted time series regression for the evaluation of public health interventions: a tutorial. Int J Epidemiol 2017;46(1):348-55. https://doi.org/10.1093/ije/dyw098
[DOI][PubMed][PMC]
18. Turner SL, Karahalios A, Forbes AB, Taljaard M, Grimshaw JM, Cheng AC, et al. Design characteristics and statistical methods used in interrupted time series studies evaluating public health interventions: protocol for a review. BMJ Open 2019;9(1):e024096. https:// doi.org/10.1136/bmjopen-2018-024096
[DOI][PubMed][PMC]
19. Linden, A. Conducting interrupted time-series analysis for single-and multiple-group comparisons. The Stata Journal 2015;15(2):480-500. https://doi.org/10.1177/1536867X1501500208
[DOI]
20. Ahn S, Kim NH, Kim YN. Comparison of health status and the effectiveness of health cost between rural and urban residents. Jeonnam: Korea Rural Economic Institue; 2019: 10-6.
21. Chen X, Orom H, Hay JL, Waters EA, Schofield E, Li Y, et al. Differences in rural and urban health information access and use. J Rural Health 2019;35(3):405-17. https://doi.org/10.1111/jrh.12335
[DOI][PubMed][PMC]
22. Park GR, Choi BH. Association between unmet healthcare needs and unmet long-term care needs among the Korean elderly. Health Soc Welf Rev 2018;38(4):40-56. https://doi.org/10.15709/hswr.2018.38.4.40
[DOI]
23. Santoso CMA, Bramantoro T, Nguyen MC, Bagoly Z, Nagy A. Factors affecting dental service utilisation in indonesia: a population-based multilevel analysis. Int J Environ Res Public Health 2020:22;17(15):5282. https://doi.org/10.3390/ijerph17155282
[DOI][PubMed][PMC]