Journal of Korean Society of Dental Hygiene Open access, Peer Reviewed
pISSN 2287-1705, eISSN 2288-2294
Weeks in Review
Weeks to Publication
Journal of Korean Society of Dental Hygiene Open access, Peer Reviewed
pISSN 2287-1705, eISSN 2288-2294
Yoon-Young Choi , Eun-Seo Jung, Kyeong-Jin Lee, Hyun-Young Moon, Kyeong-Hee Lee
Department of Dental Hygiene, Shinhan University
Corresponding Author: Kyeong-Hee Lee, Department of Dental Hygiene, Shinhan University, 95 Hoam-ro, Uijeongbu-si, Gyeonggi-do 11644, Republic of Korea. Tel: +82-31-870-3452, Fax: +82-31-870-3459, E-mail: noh3898@hanmail.net
Volume 26, Number 5, Pages 589–602, October 2026.
J Korean Soc Dent Hyg 2026;26(5):589–602. https://doi.org/10.13065/jksdh.2026.26.5.3
Received on August 18, 2026, Revised on September 27, 2026, Accepted on October 15, 2026, Published on October 30, 2026.
Copyright © 2026 by Journal of Korean Society of Dental Hygiene.
This is an Open Access article distributed under the terms of the Creative Commons Attribution Non-Commercial License(http://creativecommons.org/licenses/by-nc/4.0/).

Aged, Electroencephalography, Myofunctional therapy, Smartphone, Social support
Advancements in information and communication technology (ICT) and the widespread adoption of smartphones have substantially transformed the daily lives and health management practices of older adults [1]. As smartphone adoption among older adults continues to increase, mobile-based health interventions are becoming increasingly feasible and accessible for this population. Concurrently, rapid population aging has intensified health-related challenges, including cognitive decline, depression, and sleep disorders, which can reduce quality of life among older adults [2,3]. Accordingly, there is a growing need to develop effective and accessible smartphone-based strategies for health promotion and disease prevention in this population.
Smartphone-based health management content can be utilized without temporal or spatial constraints, thereby enhancing older adults’ ability to engage in self-directed health management and positively influencing psychological stability and the maintenance of social relationships [4,5]. Moreover, such digital-based interventions are meaningful, as they improve access to health-related information and support continuity of health management. These characteristics may be particularly important for older adults, for whom sustained participation in health promotion activities is often difficult.
Meanwhile, oral health is a critical component of overall systemic health. Age-related declines in oral muscle strength can impair mastication and swallowing, potentially leading to poor nutritional status [6]. These impairments may also hinder communication and increase social withdrawal, thereby exacerbating emotional distress and cognitive decline. Consequently, increasing attention has been directed toward the potential relationship between oral function and mental health in older adults.
Previous studies have demonstrated that oral function–enhancing exercises are effective in improving oral health and quality of life [7]. Strengthening oral muscles may also positively influence systemic health through physiological changes such as increased salivary secretion [8]. Furthermore, repetitive stimulation of oral muscles, including masticatory activity, has been reported to activate sensory and motor pathways via the trigeminal nerve, thereby increasing cerebral blood flow in key regions, such as the prefrontal cortex and hippocampus, and activating the central nervous system [9,10]. These neurophysiological responses may also be associated with emotional regulation, cognitive functioning, and psychological well-being.
These mechanisms suggest that improvements in oral function may extend beyond simple physical changes to induce meaningful alterations in brain function, which can be objectively quantified using electroencephalogram (EEG) indices. Notably, increased alpha wave activity is associated with psychological stability and relaxation, while changes in specific frequency bands have been reported to be closely related to cognitive processing ability and sleep quality [11]. Therefore, interventions aimed at improving oral function may have the potential to enhance mental function through measurable changes in EEG activity. In the present study, mental health was conceptualized as psychological well-being reflected through emotional status, sleep quality, and neurophysiological indicators measured using EEG.
Despite these advances, most existing oral health interventions rely on face-to-face delivery, limiting accessibility and long-term adherence. In contrast, digital-based interventions utilizing smartphones can overcome temporal and spatial constraints and serve as powerful tools by providing real-time visual guidance and feedback. These features allow older adults to practice oral exercises at their own pace, repeat them when necessary, and revisit the instructions, which may support accurate performance and continued participation.
Previous studies have generally examined oral exercise and digital health interventions as separate approaches. Research combining smartphone-based oral muscle-strengthening training with EEG assessment in older adults remains scarce, and little is known about its effects on mental health, sleep quality, and EEG activity.
Therefore, an integrated approach that combines digital-based interventions with improvements in oral function holds promise as a novel strategy for enhancing mental function in older adults. Accordingly, we conducted a randomized controlled trial to examine whether smartphone application–based oral muscle-strengthening training affects mental health, sleep quality, and EEG activity in older adults.
The study hypotheses are as follows: First, older adults receiving smartphone application-based oral muscle-strengthening training will show greater improvements in mental health than those in the control group. Second, older adults receiving smartphone application-based oral muscle-strengthening training will show greater improvements in sleep quality than those in the control group. Third, smartphone application–based oral muscle-strengthening training will induce significant changes in EEG activity in older adults.
We used a randomized controlled pretest–posttest design to examine the effects of smartphone-based oral muscle-strengthening training on social support and EEG activity in older adults. Following the baseline assessment, participants were assigned to the intervention or control group in a 1:1 ratio using a computer-generated simple randomization sequence. An independent researcher who had no role in recruitment, intervention delivery, or outcome assessment generated the sequence and assigned the participants. Group allocation was not disclosed to participants until the assignment process had been completed.
Prior to study initiation, ethical approval was obtained from the Institutional Review Board of Shinhan University (Approval No.: SHIRB-202504-HR-261-02). All participants provided written informed consent after receiving a full explanation of the study purpose and procedures. The trial was registered with the Clinical Research Information Service of the Korean government (KCT0011939) and is listed on the World Health Organization International Clinical Trials Registry Platform. The study was performed in accordance with the Declaration of Helsinki.
Participants were recruited using a non-probability sampling method in collaboration with senior welfare centers located in the metropolitan area. Eligibility criteria included adults aged ≥65 years who were able to communicate and ambulate independently, owned a personal mobile phone, and were able to use the application-based content through simple operations. All eligible individuals were fully informed about the purpose and procedures of the study and voluntarily agreed to participate.
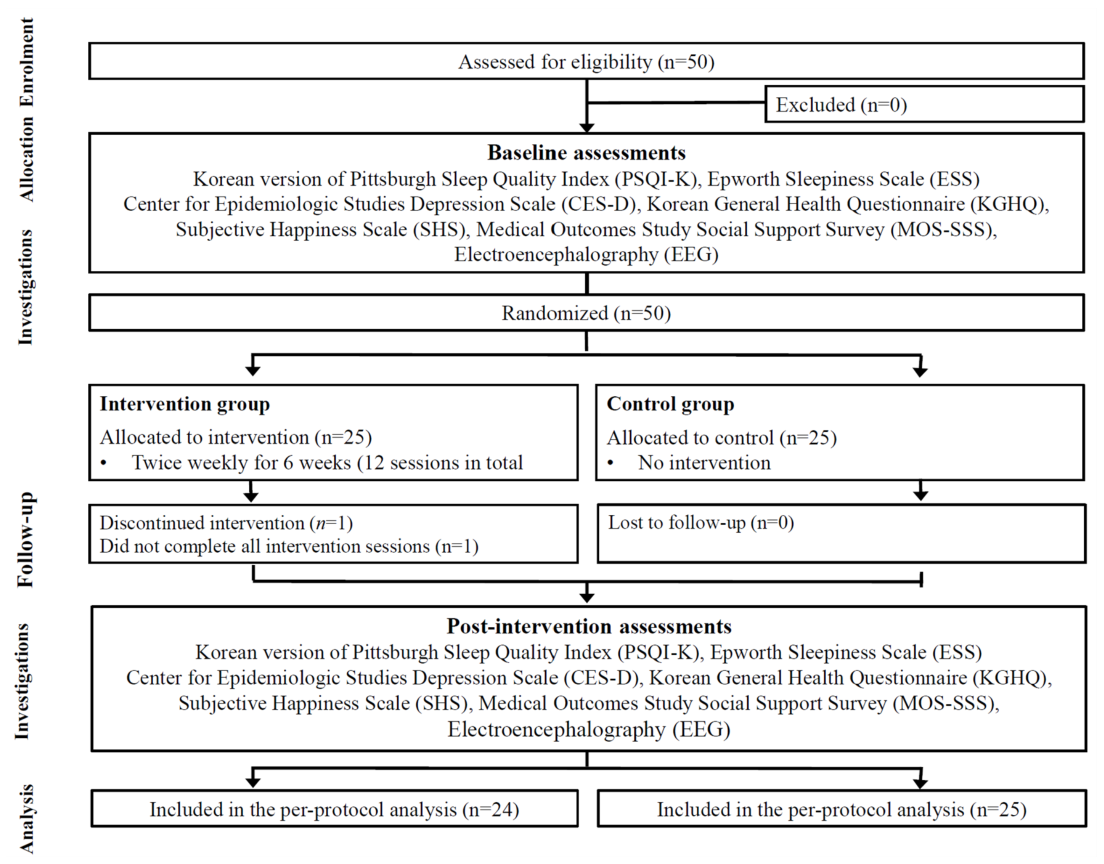
Sample size was determined using G*Power (ver. 3.1.9.4; Heinrich Heine University Düsseldorf, Düsseldorf, Germany) to estimate the minimum number of participants required to detect between-group differences in mean outcomes for the smartphone application–based oral health intervention. Because no directly comparable previous study was available, an effect size of Cohen’s d=0.80 was selected based on Cohen’s conventional criterion for a large effect [12]. Assuming a significance level of 0.05, statistical power of 0.80, and an independent-samples t-test (one-tailed test), a minimum of 21 participants per group (total n=42) was required. Considering potential attrition, 25 participants were initially assigned to each group (n=50 total). After excluding one participant who did not complete the intervention sessions, the final analysis included data from 24 participants in the intervention group and 25 participants in the control group <Fig. 1>.
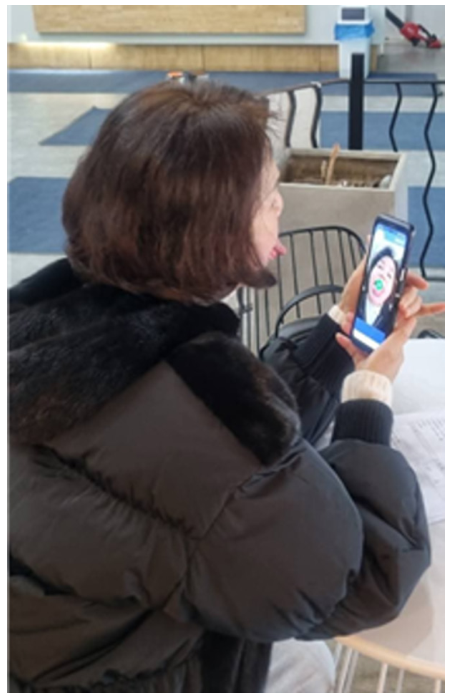
First, smartphone application–based content for oral muscle-strengthening training was developed. The content comprised six video modules—pre-meal exercises, lip exercises, oral (mouth) exercises, gum massage, salivary gland massage, and tongue exercises—as well as pronunciation training and tongue exercise games <Fig. 2>.
The intervention was implemented over 6 weeks (August–October 2025) and consisted of a total of 12 sessions. All sessions were conducted at participants’ affiliated institutions, and lasted approximately 60 minutes each.
Prior to the start of the program, the researcher assisted participants in downloading the smartphone application and provided direct instructions on how to use it. Training continued until participants were able to use the application independently and comfortably. During the intervention period, participants in the intervention group were encouraged to engage in self-directed learning by utilizing the oral exercise videos and game-based content embedded in the application. The control group received no intervention during the study period; however, the same intervention was provided after completion of the study.
To evaluate the effectiveness of the intervention, assessments were conducted 1 week before the intervention and 3 days after its completion. Adherence was checked using the application usage logs. A session counted as completed when the participant used the application for at least 40 minutes, and the per-protocol analysis included only those who completed all 12 sessions. To ensure consistency and minimize assessor bias, the same raters conducted both assessments and were blinded to group allocation.
To evaluate the effects of oral muscle-strengthening training, self-administered questionnaires were utilized. Participants’ general characteristics included sex, age, educational level, economic status, marital status and cognitive function, assessed using the Korean version of the Mini-Mental State Examination (MMSE-K) [13]. The MMSE-K was used as a descriptive variable to characterize participants’ baseline cognitive function and assess baseline comparability between the intervention and control groups. It was administered individually by a trained researcher in a quiet environment and scored according to the standardized scoring criteria. It comprises seven domains—attention and calculation, registration, recall, language, visuospatial construction, time orientation, and place orientation—with a total score of 30. Higher scores indicate better cognitive function, and scores ≥24 indicate normal cognitive function. Cronbach’s α for the MMSE-K in this study was 0.87.
Oral health–related behavioral characteristics included daily toothbrushing frequency, tongue cleaning, gum cleaning, use of oral hygiene products, use of toothpicks, and experience of dental scaling within the past 6 months.
Mental health status was assessed by measuring depression, general mental health, subjective happiness, and social support. Depression was measured using the Center for Epidemiologic Studies Depression Scale, developed by the National Institute of Mental Health [14]. Higher scores indicate greater depressive symptoms. Cronbach’s α for the depression scale in this study was 0.86. General mental health status was assessed using a 20-item Korean-language version of the General Health Questionnaire (KGHQ), originally developed by Goldberg [15]. The instrument was rated on a five-point Likert scale, yielding a total possible score of 100, with higher scores indicating better mental health. Cronbach’s α for this instrument in this study was 0.90. Subjective happiness was measured using the 19-item scale employed by Pyo et al. [16]. Each item was rated on a five-point Likert scale, yielding a maximum score of 95, with higher scores indicating greater subjective happiness. Cronbach’s α for the subjective happiness scale in this study was 0.84. Social support was assessed using the Medical Outcomes Study Social Support Survey, developed by Sherbourne and Stewart [17]. This instrument includes 19 items rated on a five-point Likert scale, with a total possible score of 95; higher scores indicate greater perceived social support. Cronbach’s α for the social support scale in this study was 0.96. Sleep health was evaluated using the Korean version of the Pittsburgh Sleep Quality Index (PSQI-K), whose reliability and validity were established by Sohn et al. [18]. The PSQI-K assesses subjective sleep quality during the previous month and comprises seven component scores. Each component is scored from 0 to 3, with lower global scores indicating better sleep quality; a global score ≥5 indicates poor sleep quality. Cronbach’s α for the PSQI-K in this study was 0.83. Daytime sleepiness was assessed using the Epworth Sleepiness Scale (ESS), developed by Johns [19]. The ESS is an eight-item self-report instrument that evaluates the likelihood of dozing off in common daily situations. Higher scores indicate greater daytime sleepiness, and a total score ≥10 is generally interpreted as indicating excessive daytime sleepiness. Cronbach’s α for the ESS in this study was 0.89.
Electroencephalographic activity was recorded to assess neurophysiological changes after the intervention. Recordings were obtained using Neurobrain (Neuro21, Seoul, Korea), a portable two-channel EEG system developed by the Korea Institute of Brain Science [20]. Electrodes were placed over the left (Fp1) and right (Fp2) prefrontal regions according to the International 10–20 system, with the reference electrode attached to the left earlobe. Signals were recorded within a frequency range of 1–30 Hz at a sampling rate of 256 Hz and a measurement precision of ±0.6 μV.
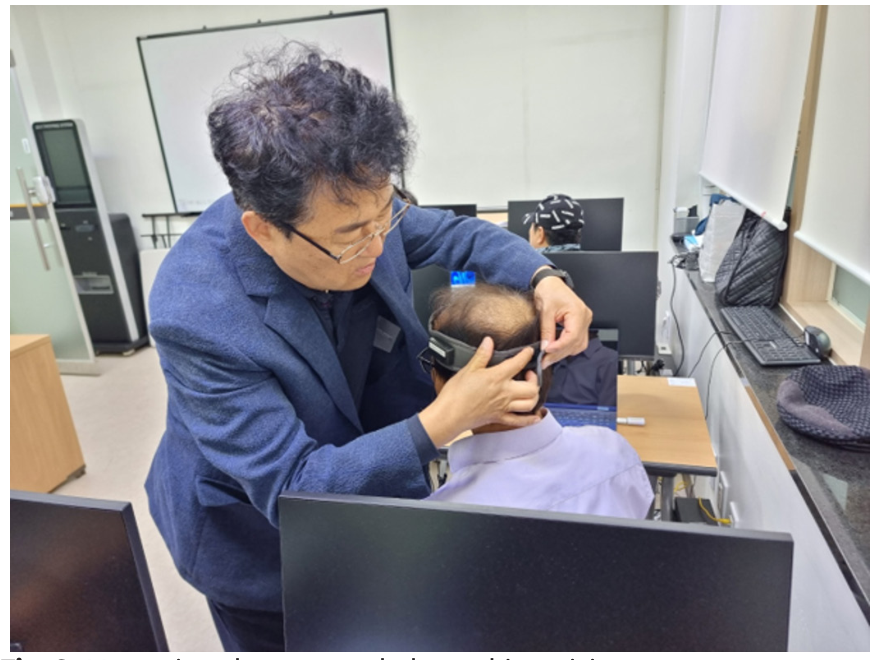
The same investigator performed all measurements in a quiet, separate room. Participants rested for 5 minutes before recording, and any materials that could affect electrode contact or signal acquisition were removed. Resting-state EEG was then recorded for 5 minutes with the participants’ eyes closed <Fig. 3>. They were asked to remain still, close their eyes gently, and minimize facial and eye movements to reduce movement- and eye-related artifacts.
The signals were digitized and analyzed using fast Fourier transform power-spectrum analysis. Frequency bands were defined as delta (0–3 Hz), theta (4–7 Hz), alpha (8–12 Hz), sensorimotor rhythm (SMR; 12–15 Hz), low beta (16–20 Hz), and high beta (21–30 Hz). The EEG indices were calculated using the Brain Function Measurement analysis program.
The analysis focused on changes in relaxation, attention, interhemispheric balance, and stress-related activity rather than the diagnosis of cognitive or emotional disorders. The variables were grouped into activation and attention indices (alpha average, arousal level, attention, and concentration), interhemispheric indices (amplitude symmetry and coherence), and stress and emotional-state indices (physical stress, mental stress, rest, behavioral ratio, and emotional ratio). Age-standardized index and frequency were treated as general summary measures. The remaining device-derived indices were considered exploratory outcomes.
Arousal level was calculated as the ratio of theta to SMR activity (θ/SMR). Physical stress was derived from delta activity, whereas mental stress was derived from high-beta activity. Rest, attention, and concentration were composite indices based on the relative distribution of EEG frequency bands and were used as device-derived measures of relaxation and attentional engagement. Because
the clinical meaning of these indices has not been fully established, they were interpreted cautiously alongside the individual frequency-band measures.
Statistical analyses were performed using SPSS (ver. 22.0; IBM Corp., Armonk, NY, USA), with α set at 0.05. The Shapiro–Wilk test was used to examine the normality of the outcome variables and analysis of covariance (ANCOVA) residuals. Baseline comparability between the groups was assessed using the chi-square test, Fisher’s exact test, or independent-samples t-test, as appropriate.
Intervention effects were estimated using ANCOVA. For each outcome, the post-intervention value was entered as the dependent variable, group as the fixed factor, and the corresponding baseline value as the covariate. As several outcomes, particularly the EEG indices, deviated from normality, the ANCOVA findings for these variables were interpreted cautiously. Adjusted mean differences were calculated as intervention minus control and are reported with 95% confidence intervals, p-values, and Hedges’ g. Hedges’ g was derived from the adjusted mean difference and pooled post-intervention standard deviation, with correction for small-sample bias.
The homogeneity-of-regression-slopes assumption was examined using the baseline-by-group interaction. If this assumption was violated, a change-score analysis was conducted as a sensitivity analysis. An independent-samples t-test was used when the change scores were normally distributed; otherwise, the Mann–Whitney U test was applied. For the 13 EEG outcomes, the false discovery rate was controlled using the Benjamini–Hochberg procedure. Both unadjusted p-values and adjusted q-values are reported, with a two-sided q<0.05 indicating statistical significance after multiple-comparison correction.
Table 1 presents the participants’ baseline characteristics, including sex, age, educational level, economic status, marital status, and cognitive function assessed using the MMSE-K. No statistically significant between-group differences were observed in these characteristics (all p>0.05).
Table 1. General characteristics of the participants [Unit: n (%)]
| Characteristic | Division | Intervention group (n=24) | Control group (n=25) | Total (n=49) | p | ||||||||||||||||||||||||||
|---|---|---|---|---|---|---|---|---|---|---|---|---|---|---|---|---|---|---|---|---|---|---|---|---|---|---|---|---|---|---|---|
| Sex | Male | 2 (8.3) | 2 (8.0) | 4 (8.2) | 1.000b | ||||||||||||||||||||||||||
| Female | 22 (91.7) | 23 (92.0) | 45 (91.8) | ||||||||||||||||||||||||||||
| Age, years | 65–74 | 8 (33.3) | 8 (32.0) | 16 (32.7) | 0.710a | ||||||||||||||||||||||||||
| 75–84 | 14 (58.3) | 13 (52.0) | 27 (55.1) | ||||||||||||||||||||||||||||
| ≥85 | 2 (8.3) | 4 (16.0) | 6 (12.2) | ||||||||||||||||||||||||||||
| Education | ≤Primary school | 9 (37.5) | 8 (32.0) | 17 (34.7) | 0.756a | ||||||||||||||||||||||||||
| Middle school | 6 (25.0) | 5 (20.0) | 11 (22.4) | ||||||||||||||||||||||||||||
| ≥High school | 9 (37.5) | 12 (48.0) | 21 (42.9) | ||||||||||||||||||||||||||||
| Economic status | Upper | 6 (25.0) | 6 (24.0) | 12 (24.5) | 0.713a | ||||||||||||||||||||||||||
| Middle | 8 (33.3) | 11 (44.0) | 19 (38.8) | ||||||||||||||||||||||||||||
| Low | 10 (41.7) | 8 (32.0) | 18 (36.7) | ||||||||||||||||||||||||||||
| Marital status | Widowed | 14 (58.3) | 12 (48.0) | 26 (53.1) | 0.769a | ||||||||||||||||||||||||||
| Cohabiting | 7 (29.2) | 9 (36.0) | 16 (32.7) | ||||||||||||||||||||||||||||
| Divorced | 3 (12.5) | 4 (16.0) | 7 (14.3) | ||||||||||||||||||||||||||||
| MMSE-K (Mean±SD) | 25.79±3.74 | 26.28±2.57 | 26.04±3.18 | 0.596c | |||||||||||||||||||||||||||
MMSE-K: Korean version of the Mini-Mental State Examination; SD: standard deviation. aby chi-square, bFisher’s exact test, and cindependent t-test.
Oral health–related behavioral characteristics included tooth brushing frequency, tongue cleaning, gum cleaning, use of oral hygiene products, use of toothpicks, and experience of dental scaling within the past 6 months. No significant between-group differences were observed in oral health-related behavioral characteristics (p>0.05) <Table 2>.
Table 2. Oral health-related behavioral characteristics [Unit: n (%)]
| Characteristic | Division | Intervention group (n=24) | Control group (n=25) | Total (n=49) | p | |||||||||||||||||||||
|---|---|---|---|---|---|---|---|---|---|---|---|---|---|---|---|---|---|---|---|---|---|---|---|---|---|---|
| Daily toothbrushing frequency | 1 | 6 (25.0) | 5 (20.0) | 11 (22.4) | 0.594a | |||||||||||||||||||||
| 2 | 6 (25.0) | 4 (16.0) | 10 (20.4) | |||||||||||||||||||||||
| ≥3 | 12 (50.0) | 16 (64.0) | 28 (57.1) | |||||||||||||||||||||||
| Tongue cleaning | Always | 9 (37.5) | 9 (36.0) | 18 (36.7) | 0.984a | |||||||||||||||||||||
| Sometimes | 6 (25.0) | 6 (24.0) | 12 (24.5) | |||||||||||||||||||||||
| Never | 9 (37.5) | 10 (40.0) | 19 (38.8) | |||||||||||||||||||||||
| Gum cleaning | Always | 12 (50.0) | 12 (48.0) | 24 (49.0) | 0.827a | |||||||||||||||||||||
| Sometimes | 9 (37.5) | 11 (44.0) | 20 (40.8) | |||||||||||||||||||||||
| Never | 3 (12.5) | 2 (8.0) | 5 (10.2) | |||||||||||||||||||||||
| Use of oral hygiene products | Yes | 18 (75.0) | 21 (84.0) | 39 (79.6) | 0.496b | |||||||||||||||||||||
| No | 6 (25.0) | 4 (16.0) | 10 (20.4) | |||||||||||||||||||||||
| Use a toothpick | Yes | 11 (45.8) | 8 (32.0) | 19 (38.8) | 0.320a | |||||||||||||||||||||
| No | 13 (54.2) | 17 (68.0) | 30 (61.2) | |||||||||||||||||||||||
| Scaling within 6 months | Yes | 8 (33.3) | 14 (56.0) | 22 (44.9) | 0.111a | |||||||||||||||||||||
| No | 16 (66.7) | 11 (44.0) | 27 (55.1) | |||||||||||||||||||||||
| aby chi-square and | bFisher’s exact test. | |||||||||||||||||||||||||
Table 3 summarizes the mental health-related and sleep outcomes. After baseline adjustment, perceived social support was higher in the intervention group than in the control group (adjusted mean difference [AMD]=15.48; 95% confidence interval [CI], 10.43–20.54; p<0.001; Hedges’ g=1.73). The change-score analysis produced a similar result, with a significant difference between the groups on the independent-samples t-test (p=0.026). Happiness also favored the intervention group, although the adjusted difference was not statistically significant (AMD=5.92; 95% CI, −1.13 to 12.97; p=0.098; Hedges’ g=0.48). No significant between-group differences were found for depression, overall mental health, sleep quality, or daytime sleepiness after adjustment for baseline values.
Table 3. Effects of the smartphone-based oral muscle-strengthening intervention on sleep and mental health outcomes
| Intervention group (n=24) | Control group (n=25) | Adjusted | |||||||||||||||||||||||||||||||||||||||||||||||||||||||||||
|---|---|---|---|---|---|---|---|---|---|---|---|---|---|---|---|---|---|---|---|---|---|---|---|---|---|---|---|---|---|---|---|---|---|---|---|---|---|---|---|---|---|---|---|---|---|---|---|---|---|---|---|---|---|---|---|---|---|---|---|---|---|
| mean | |||||||||||||||||||||||||||||||||||||||||||||||||||||||||||||
| Variables | p-value | * Hedges’ g† | |||||||||||||||||||||||||||||||||||||||||||||||||||||||||||
| Pre | Post | Change | Pre | Post | Change | difference | |||||||||||||||||||||||||||||||||||||||||||||||||||||||
| (95% CI)* | |||||||||||||||||||||||||||||||||||||||||||||||||||||||||||||
| Depression (CES-D) | 19.42±13.12 | 23.67±8.54 | 4.25±15.39 | 18.68±8.91 | 22.24±9.30 | 3.56±14.63 | 1.49 | 0.565 | 0.16 | ||||||||||||||||||||||||||||||||||||||||||||||||||||
| (−3.68, 6.66) | |||||||||||||||||||||||||||||||||||||||||||||||||||||||||||||
| Mental health (KGHQ) | 65.17±5.09 | 65.33±6.24 | 0.17±7.42 | 64.12±8.69 | 65.88±8.31 | 1.76±12.57 | −0.53 | 0.807 | −0.07 | ||||||||||||||||||||||||||||||||||||||||||||||||||||
| (−4.82, 3.77) | |||||||||||||||||||||||||||||||||||||||||||||||||||||||||||||
| Happiness | 64.67±14.61 | 67.92±11.03 | 3.25±14.56 | 59.40±10.08 | 60.76±13.25 | 1.36±15.84 | 5.92 | 0.098 | 0.48 | ||||||||||||||||||||||||||||||||||||||||||||||||||||
| (−1.13, 12.97) | |||||||||||||||||||||||||||||||||||||||||||||||||||||||||||||
| Social support§ | 64.33±17.44 | 71.79±8.88 | 7.46±14.90 | 58.72±14.06 | 55.56±8.74 | −3.16±17.27 | 15.48 | <0.001 | 1.73 | ||||||||||||||||||||||||||||||||||||||||||||||||||||
| (10.43, 20.54) | |||||||||||||||||||||||||||||||||||||||||||||||||||||||||||||
| Sleep quality (PSQI-K) | 10.63±4.50 | 11.29±5.90 | 0.67±5.97 | 10.52±6.55 | 11.84±4.67 | 1.32±7.28 | −0.57 | 0.700 | −0.11 | ||||||||||||||||||||||||||||||||||||||||||||||||||||
| (−3.56, 2.41) | |||||||||||||||||||||||||||||||||||||||||||||||||||||||||||||
| Daytime sleepiness (ESS) | 5.96±4.16 | 7.83±4.03 | 1.88±5.19 | 7.00±2.86 | 7.44±1.85 | 0.44±2.92 | 0.59 | 0.508 | 0.19 | ||||||||||||||||||||||||||||||||||||||||||||||||||||
| (−1.19, 2.38) | |||||||||||||||||||||||||||||||||||||||||||||||||||||||||||||
ANCOVA: analysis of covariance; CES-D: Center for Epidemiologic Studies Depression Scale; CI: confidence interval; ESS: Epworth Sleepiness Scale; KGHQ: Korean version of the General Health Questionnaire; PSQI-K: Korean version of the Pittsburgh Sleep Quality Index; SD: standard deviation. Data are presented as mean±SD. *Adjusted mean differences (95% CIs) and p-values were obtained from ANCOVA adjusted for the corresponding baseline value; differences were calculated as intervention minus control. †Hedges’ g was calculated using the adjusted mean difference and pooled post-intervention SD with a small-sample correction. §The homogeneity-of-regression-slopes assumption was violated for social support (baseline×group interaction, p=0.044). Because the change scores were normally distributed, an independent-samples t-test was conducted as a sensitivity analysis and showed a significant between-group difference (p=0.026).
Table 4 summarizes the EEG results. After baseline adjustment, the rest index was lower in the intervention group than in the control group (AMD=−10.43; 95% CI, −17.13 to −3.73; p=0.003; Hedges’ g=−0.88). A similar difference was found for attention (AMD=−9.12; 95% CI, −14.46 to −3.77; p=0.001; Hedges’ g=−0.98). Both findings remained significant after Benjamini–Hochberg correction (q=0.020 and q=0.016, respectively). Concentration was also lower in the intervention group, but the difference did not reach statistical significance (AMD=−5.96; 95% CI, −12.18 to 0.25; p=0.060). None of the other EEG outcomes showed a significant adjusted difference between the groups. The homogeneity-of-regression-slopes assumption was not met for amplitude symmetry. As its change scores were not normally distributed, the Mann–Whitney U test was used for the sensitivity analysis and showed no significant between-group difference (p=0.992).
Table 4. Effects of the smartphone-based oral muscle-strengthening intervention on EEG outcomes
| Intervention group (n=24) | Control group (n=25) | Adjusted mean | ||||||||||||||||||||||||||||||||||||||||||||||||||||||||||||||||||||||||||||||
|---|---|---|---|---|---|---|---|---|---|---|---|---|---|---|---|---|---|---|---|---|---|---|---|---|---|---|---|---|---|---|---|---|---|---|---|---|---|---|---|---|---|---|---|---|---|---|---|---|---|---|---|---|---|---|---|---|---|---|---|---|---|---|---|---|---|---|---|---|---|---|---|---|---|---|---|---|---|---|---|---|
| Variables | difference | p-value | * q-value | † Hedges’ g‡ | ||||||||||||||||||||||||||||||||||||||||||||||||||||||||||||||||||||||||||||
| Pre | Post | Change | Pre | Post | Change | |||||||||||||||||||||||||||||||||||||||||||||||||||||||||||||||||||||||||||
| (95% CI)* | ||||||||||||||||||||||||||||||||||||||||||||||||||||||||||||||||||||||||||||||||
| Age standardization | 7.25±0.44 | 7.21±0.41 | −0.04±0.20 | 7.28±0.46 | 7.24±0.44 | −0.04±0.20 | −0.01 | 0.909 | 0.909 | −0.01 | ||||||||||||||||||||||||||||||||||||||||||||||||||||||||||||||||||||||
| (−0.12, 0.10) | ||||||||||||||||||||||||||||||||||||||||||||||||||||||||||||||||||||||||||||||||
| Frequency | 5.88±1.01 | 6.33±1.22 | 0.46±1.41 | 6.00±1.16 | 6.08±1.07 | 0.08±1.25 | 0.29 | 0.360 | 0.747 | 0.25 | ||||||||||||||||||||||||||||||||||||||||||||||||||||||||||||||||||||||
| (−0.34, 0.93) | ||||||||||||||||||||||||||||||||||||||||||||||||||||||||||||||||||||||||||||||||
| Alpha average | 5.88±5.57 | 4.85±2.82 | −1.03±5.64 | 5.65±5.52 | 5.51±4.27 | −0.13±6.79 | −0.68 | 0.517 | 0.747 | −0.18 | ||||||||||||||||||||||||||||||||||||||||||||||||||||||||||||||||||||||
| (−2.78, 1.42) | ||||||||||||||||||||||||||||||||||||||||||||||||||||||||||||||||||||||||||||||||
| Arousal level | 5.27±13.71 | 5.24±13.72 | −0.03±0.54 | 7.90±18.58 | 7.78±18.61 | −0.12±0.60 | 0.09 | 0.577 | 0.750 | 0.01 | ||||||||||||||||||||||||||||||||||||||||||||||||||||||||||||||||||||||
| (−0.24, 0.43) | ||||||||||||||||||||||||||||||||||||||||||||||||||||||||||||||||||||||||||||||||
| Amplitude | 77.23±23.74 84.44±16.92 | 7.21±21.05 | 80.69±21.68 83.62±20.80 | 2.93±13.16 | 2.74 | 0.511 | 0.747 | 0.14 | ||||||||||||||||||||||||||||||||||||||||||||||||||||||||||||||||||||||||
| symmetry§ | (−5.57, 11.04) | |||||||||||||||||||||||||||||||||||||||||||||||||||||||||||||||||||||||||||||||
| Left-right | 50.28±15.30 58.20±13.47 | 7.92±19.48 | 51.59±14.73 56.79±16.67 | 5.20±17.69 | 1.73 | 0.687 | 0.812 | 0.11 | ||||||||||||||||||||||||||||||||||||||||||||||||||||||||||||||||||||||||
| coherence | (−6.85, 10.30) | |||||||||||||||||||||||||||||||||||||||||||||||||||||||||||||||||||||||||||||||
| Physical stress | 25.84±16.47 20.50±14.56 −5.34±14.53 25.53±16.02 23.89±16.48 | −1.64±17.88 | −3.53 | 0.377 | 0.747 | −0.22 | ||||||||||||||||||||||||||||||||||||||||||||||||||||||||||||||||||||||||||
| (−11.51, 4.44) | ||||||||||||||||||||||||||||||||||||||||||||||||||||||||||||||||||||||||||||||||
| Mental stress | 2.30±2.15 | 1.95±0.81 | −0.35±2.10 | 2.30±2.10 | 2.22±1.15 | −0.08±2.30 | −0.27 | 0.355 | 0.747 | −0.26 | ||||||||||||||||||||||||||||||||||||||||||||||||||||||||||||||||||||||
| (−0.84, 0.31) | ||||||||||||||||||||||||||||||||||||||||||||||||||||||||||||||||||||||||||||||||
| Behavioral ratio | 13.01±9.15 | 13.39±9.70 | 0.37±5.89 | 13.21±10.14 14.87±10.64 | 1.66±6.82 | −1.32 | 0.464 | 0.747 | −0.13 | |||||||||||||||||||||||||||||||||||||||||||||||||||||||||||||||||||||||
| (−4.92, 2.28) | ||||||||||||||||||||||||||||||||||||||||||||||||||||||||||||||||||||||||||||||||
| Emotional ratio | 26.96±21.25 17.16±12.43 −9.80±20.96 20.48±18.56 16.34±12.82 | −4.14±17.70 | −0.66 | 0.849 | 0.909 | −0.05 | ||||||||||||||||||||||||||||||||||||||||||||||||||||||||||||||||||||||||||
| (−7.60, 6.28) | ||||||||||||||||||||||||||||||||||||||||||||||||||||||||||||||||||||||||||||||||
| Rest | 20.00±14.32 | 5.63±8.58 | −14.38±15.13 20.84±12.88 16.16±13.95 | −4.68±17.88 | −10.43 | 0.003 | 0.020 | −0.88 | ||||||||||||||||||||||||||||||||||||||||||||||||||||||||||||||||||||||||
| (−17.13, −3.73) | ||||||||||||||||||||||||||||||||||||||||||||||||||||||||||||||||||||||||||||||||
| Attention | 21.58±18.58 | 5.83±8.04 | −15.75±18.81 22.44±16.30 14.96±10.17 | −7.48±20.32 | −9.12 | 0.001 | 0.016 | −0.98 | ||||||||||||||||||||||||||||||||||||||||||||||||||||||||||||||||||||||||
| (−14.46, −3.77) | ||||||||||||||||||||||||||||||||||||||||||||||||||||||||||||||||||||||||||||||||
| Concentration | 21.29±18.40 | 7.96±8.61 | −13.33±19.24 21.44±17.40 13.92±12.37 −7.52±22.68 | −5.96 | 0.060 | 0.259 | −0.55 | |||||||||||||||||||||||||||||||||||||||||||||||||||||||||||||||||||||||||
| (−12.18, 0.25) | ||||||||||||||||||||||||||||||||||||||||||||||||||||||||||||||||||||||||||||||||
ANCOVA: analysis of covariance; CI: confidence interval; SD: standard deviation. Data are presented as mean±SD. *Adjusted mean differences (95% CIs) and p-values were obtained from ANCOVA adjusted for the corresponding baseline value; differences were calculated as intervention minus control. †q-values were calculated using the Benjamini–Hochberg false discovery rate correction across 13 EEG outcomes; q<0.05 was considered statistically significant after correction for multiple comparisons. ‡Hedges’ g was calculated using the adjusted mean difference and pooled post-intervention SD with a small-sample correction. §The homogeneity-of-regression-slopes assumption was violated for amplitude symmetry (baseline×group interaction, p=0.023); because the change scores were not normally distributed, the sensitivity analysis was conducted using the Mann–Whitney U test and showed no significant between-group difference (p=0.992).
The widespread adoption of mobile devices has enabled access to and utilization of information across diverse environments, and smartphones, in particular, are increasingly being adopted by older adults because of their accessibility and portability. Against this background, we examined whether smartphone application–based oral muscle-strengthening training influenced mental health-related outcomes, sleep health, and EEG activity in older adults. After baseline adjustment, perceived social support was higher in the intervention group than in the control group. The rest and attention EEG indices were lower in the intervention group, and both differences remained significant after multiple-comparison correction.
The higher perceived social support observed in the intervention group is consistent with previous studies reporting that ICT education positively influences the formation of social relationships among older adults [5]. The adjusted difference in social support was large, and the change-score analysis likewise indicated a significant difference between the groups. However, the homogeneity-of-regression-slopes assumption was not met for this outcome; therefore, the size of the ANCOVA estimate should be interpreted cautiously. The present findings differ from previous research suggesting that smartphone use reduces depression and loneliness while enhancing life satisfaction [21]. Instead, our results align more closely with evidence indicating that smartphone ownership or proficiency does not significantly affect depressive symptoms [22].
These discrepancies may be attributable to the characteristics of the intervention. Specifically, the program implemented in this study focused on individual-based training rather than group-based interaction, thereby limiting opportunities for emotional exchange among participants. Consequently, although smartphone-based interventions may enhance perceived social support, they may have limited effects on deeper emotional outcomes, such as depression or loneliness, which are generally influenced by sustained interpersonal relationships. Furthermore, considering previous evidence that social support from others is significantly associated with oral health behaviors [23], the observed increase in social support may reflect the supportive contact provided during the initial training, program implementation, and evaluation. Additionally, given that older adults tend to have lower levels of both physical and virtual social interaction than younger populations and that increased physical interaction plays a critical role in reducing social isolation [24], smartphone-based interventions alone may be insufficient to substantially alleviate emotional isolation or depressive symptoms.
The adjusted estimate for subjective happiness favored the intervention group by 5.92 points and corresponded to a moderate effect size, but it was not statistically significant. Thus, the current results do not establish an intervention effect on happiness. The observed difference may nevertheless merit further examination in a larger sample.
Sleep is a key indicator of overall health status in older adults and was included in this study to explore its potential relationship with changes in oral function and daily functioning. However, after adjustment for baseline values, no significant between-group differences were observed in sleep quality or daytime sleepiness. This may be attributable to the indirect nature of the intervention. As the program primarily focused on oral muscle strengthening through individualized training, it may not have directly influenced physiological factors related to sleep quality or daytime arousal. Moreover, sleep in older adults is affected by multiple factors, including chronic diseases, medication use, and psychological conditions, which may limit the effects of a single-component intervention [25].
From a neurophysiological perspective, aging is associated with atrophy of the corpus callosum and declines in cognitive and information-processing functions [26], which may lead to reduced attention, memory, and processing speed. EEG is a non-invasive method for assessing brain activity and is widely used to identify changes in cognitive and emotional states [27]. After baseline adjustment, the rest and attention indices were lower in the intervention group than in the control group, with large effect sizes. Both differences remained significant after Benjamini–Hochberg correction. Concentration was also lower in the intervention group, although this difference was not statistically significant. The other EEG indices did not differ significantly between the groups.
Lower rest and attention scores do not necessarily indicate functional decline. EEG was recorded at rest with participants’ eyes closed; thus, the differences cannot be explained directly by cognitive demands during task performance. Moreover, these indices are composite measures based on the relative distribution of EEG frequency bands, and their interpretation depends on the algorithms used to calculate them. The direction of the differences alone does not indicate whether they were beneficial or adverse. They are therefore better understood as intervention-related differences in selected neurophysiological measures rather than evidence of cognitive improvement.
Although the rest and attention findings remained significant after correction for multiple comparisons, only two of the 13 EEG indices differed between the groups. Objective cognitive measures were not included to determine their functional relevance. These findings should therefore be interpreted cautiously and confirmed in future studies.
The present findings do not fully align with previous studies suggesting that reduced alpha activity is associated with cognitive arousal [28] or that frontal alpha asymmetry may be associated with vulnerability to depression [29]. Instead, they are partially consistent with evidence indicating that the relationship between EEG activity and cognitive or emotional functioning is complex and not strictly linear [30]. Neither alpha average nor amplitude symmetry differed significantly between the groups after baseline adjustment. The change-score sensitivity analysis for amplitude symmetry also found no significant between-group difference, despite the violation of the homogeneity-of-regression-slopes assumption. The relatively short 6-week intervention may also have limited the development of stable neurophysiological changes. Future studies should therefore employ longer intervention periods and incorporate objective cognitive measures and repeated EEG assessments.
Overall, smartphone application–based oral muscle-strengthening training was associated with higher perceived social support, but did not show clear benefits for the other mental health-related or sleep outcomes. Differences were also observed in selected EEG indices; however, their clinical and cognitive meaning remains uncertain and requires cautious interpretation.
Several limitations should be acknowledged. The sample size was relatively small, participants were recruited from a limited geographic area, and the intervention period was short. Participants were required to use smartphone-based content; therefore, the findings may not apply to older adults with limited smartphone experience or lower digital literacy. In addition, the homogeneity-of-regression-slopes assumption was not met for social support or amplitude symmetry, although change-score analyses were performed to assess these results. In addition, the absence of objective cognitive outcomes limits the interpretation of the EEG findings. The analysis was also limited to participants who completed the intervention and post-intervention assessment. This per-protocol approach may have introduced selection bias related to adherence. Future studies should employ larger and more diverse samples, include older adults with varying levels of digital literacy and provide appropriate technical support, extend the intervention period, include objective cognitive assessments and repeated EEG measurements, and incorporate greater participant interaction to evaluate more comprehensive and sustained effects.
This study examined the effects of smartphone application–based oral muscle-strengthening training on mental health-related outcomes, sleep health, and electroencephalographic (EEG) activity in older adults.
The final analysis included 49 adults aged ≥65 years: 24 in the intervention group and 25 in the control group. Participants in the intervention group completed 12 training sessions over 6 weeks. Outcomes were measured before and after the intervention. Between-group effects were assessed using analysis of covariance with adjustment for baseline values. Change-score analyses were added when the homogeneity-of-regression-slopes assumption was not met, and the Benjamini–Hochberg procedure was applied to the 13 EEG outcomes.
After baseline adjustment, perceived social support was higher in the intervention group than in the control group (AMD=15.48; 95% CI, 10.43–20.54; p<0.001; Hedges’ g=1.73). The change-score analysis also showed a significant difference (p=0.026). No significant differences were found for the other mental health-related or sleep outcomes. Rest (AMD=−10.43; 95% CI, −17.13 to −3.73; p=0.003; q=0.020) and attention (AMD=−9.12; 95% CI, −14.46 to −3.77; p=0.001; q=0.016) were lower in the intervention group and remained significant after multiple-comparison correction.
The intervention was associated with higher perceived social support and differences in selected EEG indices. The clinical meaning of the EEG findings remains uncertain, and larger, longer-term studies involving older adults with varied levels of digital literacy are needed.
Conceptualization: KH Lee, YY Choi; Data collection: HY Moon, KJ Lee; Formal analysis: ES Jung; Writing – original draft: YY Choi; Writing – review & editing: KH Lee, YY Choi
The authors declared no conflicts of interest.
This research was supported by the National Research Foundation of Korea (NRF) funded by the Korean Government (Ministry of Science and ICT) (Grant No. 2022R1A2C2010905).
This study was approved by the Institutional Review Board (IRB) of Shinhan University (Approval No.: SHIRB-202504-HR-261-02).
The datasets generated during the current study are available from the corresponding author upon request.
This study was previously presented as an oral presentation at the 2026 Spring Conference of the Korean Society of Dental Hygiene.
The authors used ChatGPT (OpenAI) to improve English expression and grammar during the preparation of this manuscript. All AI-generated suggestions were reviewed and revised by the authors, who take full responsibility for the final content of the manuscript.
1. Alruwaili MM, Shaban M, Ramadan OME. Digital health interventions for promoting healthy aging: a systematic review of adoption patterns, efficacy, and user experience. Sustainability 2023;15(23):16503.
[DOI]
2. Blazer DG. Depression in late life: review and commentary. J Gerontol A Biol Sci Med Sci 2003;58(3):M249–65.
[DOI][PubMed]
3. Foley DJ, Ancoli-Israel S, Britz P, Walsh J. Sleep disturbances and chronic disease in older adults: results of the 2003 National Sleep Foundation Sleep in America Survey. J Psychosom Res 2004;56(5):497–502.
[DOI][PubMed]
4. Kim M, Kang Y, Jung D, Lee G. Older adults’ smartphone use and access to health information. J Qual Res 2013;14(1):13–22.
[DOI]
5. Yoon H, Lee O, Beum K, Gim Y. Effect of IT education on on-line social relationship of older adults. J Korea Contents Assoc 2015;15(5):283–94.
[DOI]
6. Kim YK, Park JR, Yoo JH, Jang JH, Jeong MO, Jung JY, et al. Diseases of geriatric dental hygiene. Seoul: Komoonsa; 2020: 559–66.
7. Cho EP. Impact of oral function improving exercise on the oral function and quality of life in the elderly [Doctoral dissertation]. Daejeon: Chungnam National University, 2009.
8. Jeon YJ, Choi JS, Han SJ. The effect of dry mouth improvement by oral exercise program in elderly people. J Korean Soc Dent Hyg 2012;12(2):293–305.
[DOI]
9. Hirano Y, Obata T, Takahashi H, Tachibana A, Kuroiwa D, Takahashi T, et al. Effects of chewing on cognitive processing speed. Brain Cogn 2013;81(3):376–81.
[DOI][PubMed]
10. Avivi-Arber L, Sessle BJ. Jaw sensorimotor control in healthy adults and effects of ageing. J Oral Rehabil 2018;45(1):50–80.
[DOI][PubMed]
11. Klimesch W. EEG alpha and theta oscillations reflect cognitive and memory performance: a review and analysis. Brain Res Brain Res Rev 1999;29(2–3):169–95.
[DOI][PubMed]
12. Cohen J. A power primer. Psychol Bull 1992;112(1):155–9.
[DOI]
13. Park JH, Kwon YC. Standardization of Korean version of mini-mental state examination (MMSE-K) for use in the elderly. Part II. Diagnostic validity. J Korean Neuropsychiatr Assoc 1989;28(3):508–13.
14. Radloff LS. The CES-D scale: a self-report depression scale for research in the general population. Appl Psychol Meas 1977;1(3):385–401.
[DOI]
15. Goldberg DP. The detection of psychiatric illness by questionnaire: a technique for the identification and assessment of non-psychotic psychiatric illness. London: Oxford University Press; 1972.
16. Pyo J, Cho J, Kim SH. The effect of social participation activities and ability to perform daily life in old age on happiness through self-esteem. J Humanit Soc Sci 21 2021;12(3):673–88.
[DOI]
17. Sherbourne CD, Stewart AL. The MOS social support survey. Soc Sci Med 1991;32(6):705–14.
[DOI][PubMed]
18. Sohn SI, Kim DH, Lee MY, Cho YW. The reliability and validity of the Korean version of the Pittsburgh Sleep Quality Index. Sleep Breath 2012;16(3):803–12.
[DOI][PubMed]
19. Johns MW. A new method for measuring daytime sleepiness: the Epworth Sleepiness Scale. Sleep 1991;14(6):540–5.
[DOI][PubMed]
20. Ahn YK. A study on the effect of neurofeedback program on brain activity, arousal, and stress in the elderly [Master’s thesis]. Pocheon: CHA University, 2022.
21. Kim MY. The effects of smartphone use on spouse relationship satisfaction, children relationship satisfaction, and satisfaction with social acquaintance relationship among older adults. J Korea Acad Ind Coop Soc 2018;19(3):219–28.
[DOI]
22. Choi EH, Kim MJ, Kim YB, Ryu HJ, Lee HS, Son DJ, et al. The relationships among mental, health behavior, and the ability and range of the smartphone utilization of the elderly. J Kyungpook Nurs Sci 2016;20(1):36–47.
23. Shin Y, Hong J, Kim Y, Chang KW. Effect of social support and self-esteem on the oral health behaviors of Korean elderly people. J Korean Acad Oral Health 2017;41(4):282–9.
[DOI]
24. Choi H. Division of social interaction community across generations and its relations with social isolation. Korean J Soc Welf Res 2018;57:5–27.
[DOI]
25. Amato L, Giannetta N, Taborri S, Dionisi S, Panattoni N, Di Simone E, et al. Sleep quality and medication adherence in older adults: a systematic review. Clocks Sleep 2024;6(3):488–98.
[DOI][PubMed][PMC]
26. Raz N, Gunning FM, Head D, Dupuis JH, McQuain J, Briggs SD, et al. Selective aging of the human cerebral cortex observed in vivo: differential vulnerability of the prefrontal gray matter. Cereb Cortex 1997;7(3):268–82.
[DOI][PubMed]
27. Egner T, Gruzelier JH. EEG biofeedback of low beta band components: frequency-specific effects on variables of attention and event-related brain potentials. Clin Neurophysiol 2004;115(1):131–9.
[DOI][PubMed]
28. Başar E, Güntekin B. A short review of alpha activity in cognitive processes and in cognitive impairment. Int J Psychophysiol 2012;86(1):25–38.
[DOI][PubMed]
29. Stewart JL, Bismark AW, Towers DN, Coan JA, Allen JJB. Resting frontal EEG asymmetry as an endophenotype for depression risk: sex-specific patterns of frontal brain asymmetry. J Abnorm Psychol 2010;119(3):502–12.
[DOI][PubMed][PMC]
30. Hughes JR, Shanmugham S, Wetzel LC, Bellur S, Hughes CA. The relationship between EEG changes and cognitive functions in dementia: a study in a VA population. Clin Electroencephalogr 1989;20(2):77–85.
[DOI][PubMed]
목적: 본 연구는 노인을 대상으로 스마트폰 애플리케이션 기반 구강근육 강화훈련이 정신건강 관련 결과, 수면건강 및 뇌파(electroencephalographic, EEG) 활동에 미치는 효과를 평가하였다. 방법: 만 65세 이상 노인 49명(실험군 24명, 대조군 25명)을 최종 분석하였다. 실험군은 6주간 총 12회의 구강근육 강화운동을 수행하였다. 중재효과는 사후값을 종속변수, 집단을 고정요인, 기저값을 공변량으로 한 공분산분석으로 검증하였다. 회귀기울기 동질성 가정이 충족되지 않은 경우 변화량을 이용한 민감도 분석을 시행하였으며, 13개 EEG 지표에는 Benjamini–Hochberg 보정을 적용하였다. 결과: 기저값 보정 후 사회적 지지는 실험군이 대조군보다 유의하게 높았으며(조정평균차[adjusted mean difference, AMD]=15.48; 95% 신뢰구간[confidence interval, CI], 10.43–20.54; p<0.001; Hedges’ g=1.73), 민감도 분석에서도 유의한 군 간 차이가 나타났다(p=0.026). 다른 정신건강 관련 결과와 수면건강 지표에서는 유의한 차이가 없었다. EEG 지표 중 휴식(AMD=−10.43; 95% CI, −17.13 to −3.73; p=0.003; q=0.020)과 주의력(AMD=−9.12; 95% CI, −14.46 to −3.77; p=0.001; q=0.016)은 실험군에서 유의하게 낮았으며, 다중비교 보정 후에도 유의하였다. 결론: 스마트폰 애플리케이션 기반 구강근육 강화훈련은 노인의 높은 지각된 사회적 지지 및 일부 EEG 지표의 변화와 관련이 있었다. 그러나 EEG 변화의 임상적 의미는 명확하지 않으므로, 다양한 지역과 디지털 활용능력을 가진 노인을 포함한 대규모 장기 연구가 필요하다. 주요어: 노인, 뇌파검사, 구강근기능요법, 스마트폰, 사회적 지지